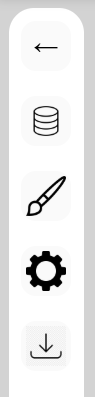
Permanent Sidebar
Show/Hide: Quickly toggle the sidebar to maximize your viewing area and focus on the plot when needed.
File Selection: Load your database and log files and also select the signals to be plotted.
Plot Adjustments: Customize line styles, colors, and markers to make your data clearer and easier to interpret.
Y Axis limits: Manually set min and max values for each Y axis to fine-tune the graph scale.
Export as CSV: Save the visible data points as a CSV file for further analysis or documentation.
Hover Toolbar
Toogle Hover: Enable or disable the hover functions.
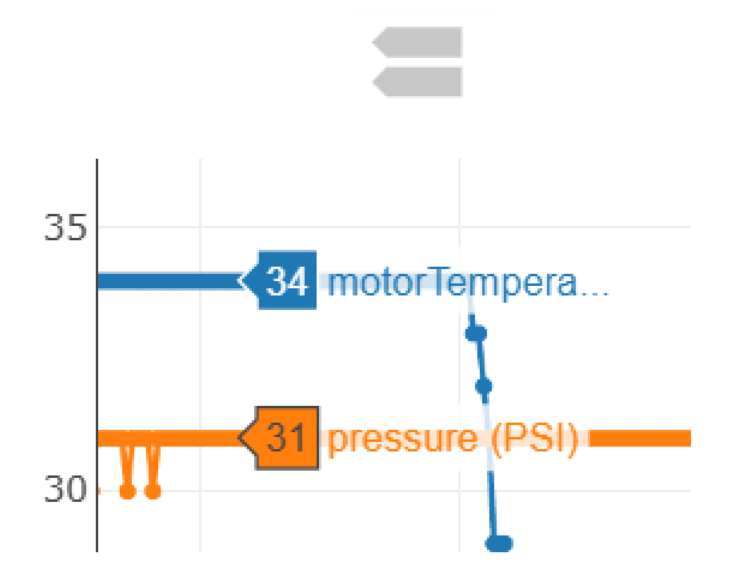
Compare: Shows measurements for all signals at the same instant in X, making comparison easy.
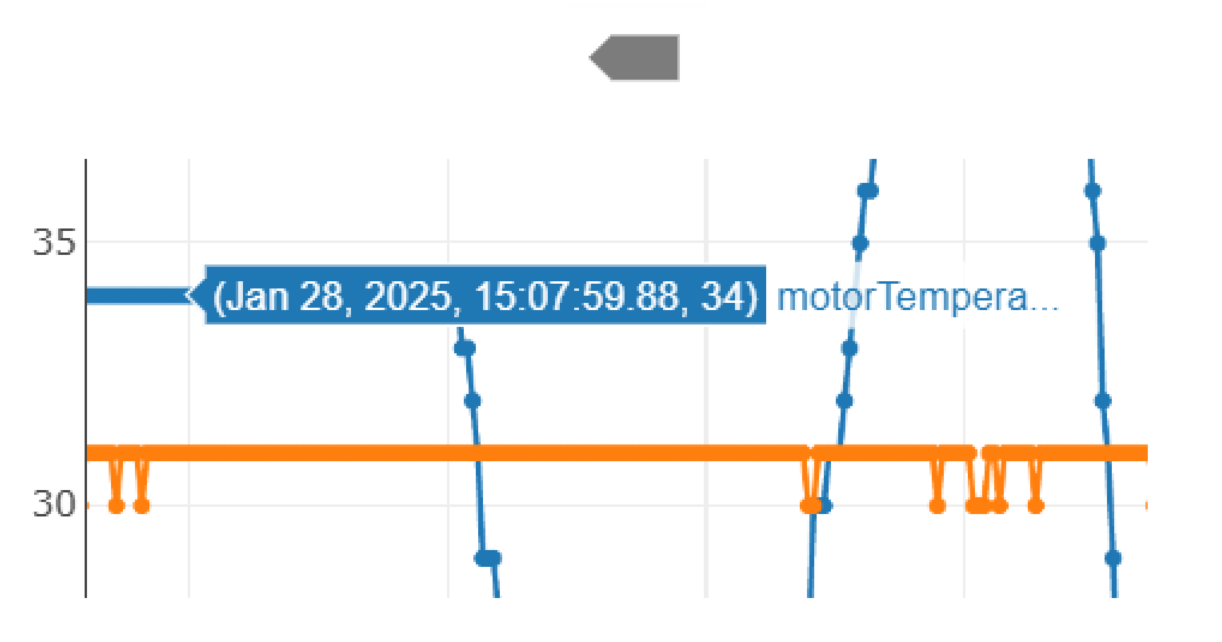
Closest: Highlights the closest measurement to the mouse pointer.
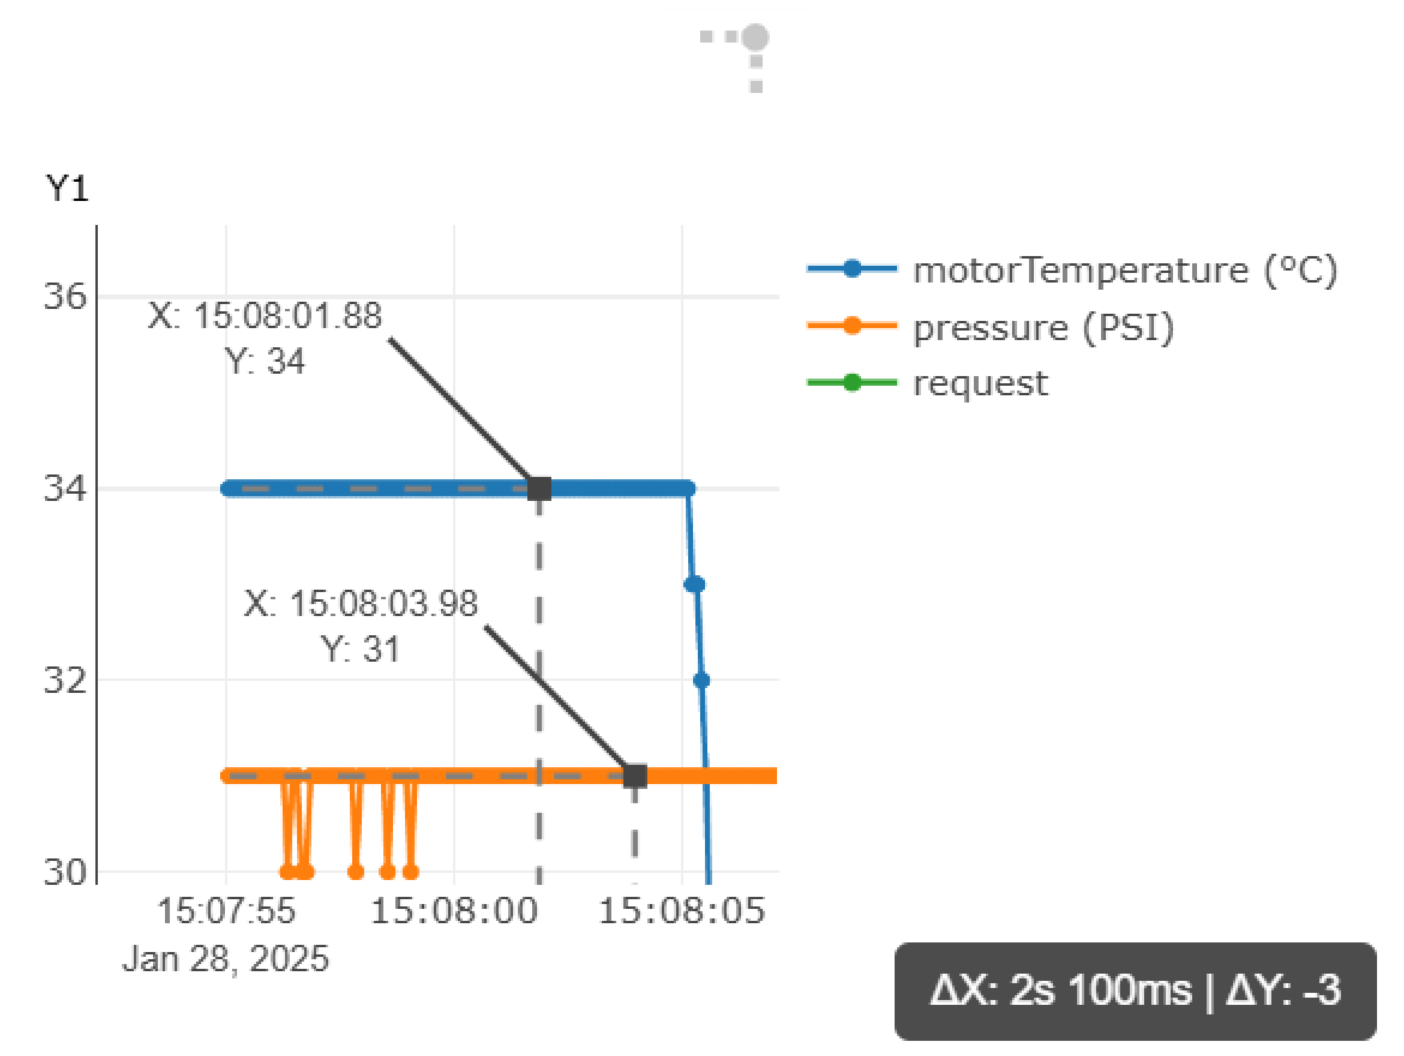
Delta Cursor: Activate two cursors to measure value differences and time gaps between points.

Hover Compare
Hover over the plot: Displays the Y values of all visible signals at the same X-axis position, making it easy to analyze correlations and trends across signals.
Enabled by default.
Use Toogle Hover to disable.
Hover Closest
Hover over the plot: Displays the Y value of the closest visible signal.
Click on the icon to enable.
Use Toogle Hover to disable.
Delta Cursor
Click to place cursor: Adds two reference points on the plot to measure the time and value difference between any two data positions. Each click places a cursor. Subsequent clicks reset cursor.
Click on the icon to enable. Automatically enable "Hover Closest".
Use icon or Toogle Hover to disable.
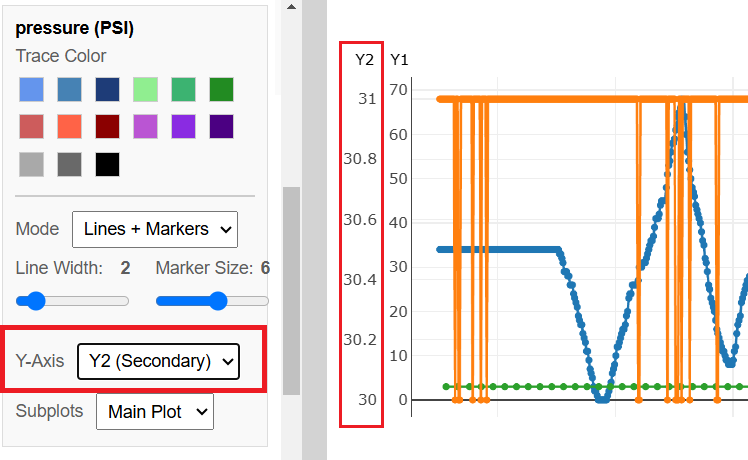
Additional Y-Axis
Droplist Y-Axis: The Y-axis dropdown lets you assign each signal to one of three vertical axes (Y1, Y2, or Y3), allowing you to separate signals with different scales or units for clearer visualization. This helps reduce overlap and makes the plot easier to read.
Only available on the main plot.
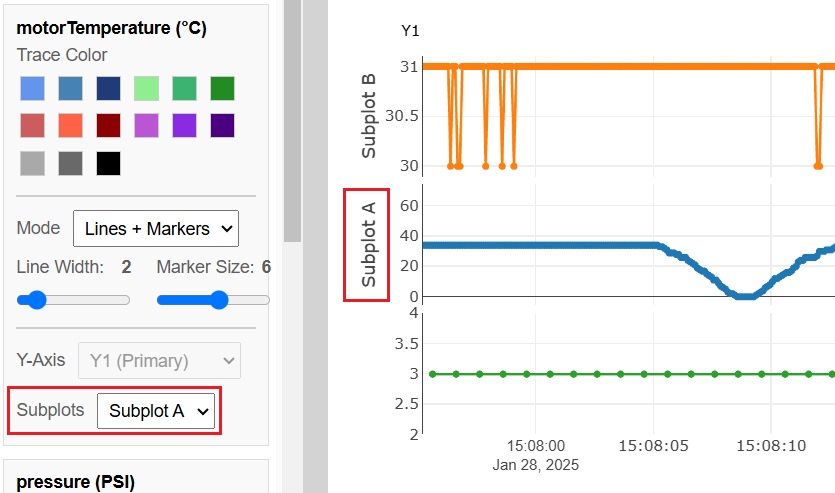
Subplots
Droplist Subplots: The subplot dropdown allows you to assign signals to one of five separate plots stacked vertically. This is useful when working with many signals or different data types, helping you organize and compare them without visual clutter.
Zoom by Scrolling
Scroll: Zoom in/out X and Y
Ctrl + Scroll: Zoom in/out X
Shift + Scroll: Zoom in/out Y
!!Video will follow!! Watch the Nyancat in the meantime.

Zoom by Dragging
Double Click: Autoscale
Scroll: Zoom in/out X and Y
Ctrl + Scroll: Zoom in/out X
Shift + Scroll: Zoom in/out Y
!!Video will follow!! Watch the Nyancat in the meantime.